
How FinDaS built the valuation engine behind Cointelegraph's institutional crypto reports.
FinDaS collaborated with Cointelegraph Research to build fundamental valuation models for top-20 cryptocurrencies, applying Quantity Theory of Money frameworks across 20+ addressable markets for an exclusive institutional investor report series.

Wow, Hristo was so professional, timely, and thorough. He is excellent with cryptocurrency analysis and math. I couldn't have been happier with anyone else. Will work with him again soon.
TL;DR
- Client: Cointelegraph Research, one of the largest crypto media and research organizations globally
- Challenge: Build defensible, fundamental valuation models for top-20 cryptocurrencies that institutional investors would trust for allocation decisions
- Approach: FinDaS applied Quantity Theory of Money (MV = PQ) frameworks, mapping 20+ total addressable markets, calibrating token velocities from on-chain data, and modeling adoption S-curves across a 12-year projection horizon
- Result: Three 50+ page institutional-grade reports published over 2019 to 2021, becoming part of Cointelegraph's exclusive paid research offering for institutional subscribers
What problems did Cointelegraph Research have?
No defensible valuation framework for crypto assets
Most cryptocurrency analysis in 2019 relied on technical indicators, sentiment, and narrative. Cointelegraph Research needed a fundamentals-based valuation methodology that institutional investors (accustomed to DCF models, comparable analysis, and market-sizing frameworks in traditional finance) would take seriously. The problem was not a lack of price predictions. It was a lack of economic logic behind those predictions.
Identifying and sizing crypto's total addressable markets
To value Bitcoin or Ethereum fundamentally, you need to answer: what real-world economic activity will these networks capture? That question requires mapping every sector crypto could disrupt, from medium of exchange and store of value to lending, insurance, e-commerce, gaming, IoT, and DAOs, and attaching a credible market size and growth rate to each. No off-the-shelf dataset existed for this. It had to be assembled from scratch, sourced, and cross-validated.
Velocity: the variable most analysts get wrong
In the Quantity Theory of Money, velocity (how fast a token changes hands) is the variable that determines whether a network's economic activity translates into token price or not. High velocity suppresses price; low velocity supports it. In crypto, velocity is notoriously difficult to estimate because on-chain transaction data conflates real economic use with speculative trading, exchange transfers, and bot activity. Getting velocity right was essential. Getting it wrong would have invalidated the entire model.
Bridging crypto economics and institutional expectations
The final report had to speak two languages simultaneously: the language of crypto-native readers who understand staking, EIP-1559, and proof-of-stake, and the language of institutional allocators who think in discount rates, penetration curves, and IRR. Cointelegraph needed a partner who could operate fluently in both worlds and produce a deliverable that neither dumbed down the crypto mechanics nor assumed TradFi knowledge of on-chain dynamics.
How did FinDaS approach the problem?
Protocol and Business Deep Dive
Hristo and the FinDaS team worked closely with Demelza Hays and the Cointelegraph Research team to map the economic functions of each cryptocurrency under analysis. For Bitcoin, this meant defining its roles across medium of exchange, store of value, lending collateral, and settlement layer. For Ethereum, the analysis expanded to include DeFi, smart contract platforms, NFTs, and the staking dynamics introduced by the move to proof-of-stake. Each asset required a distinct economic profile before any numbers could be attached.
Token Utility and Value Capture Design
The team selected the Quantity Theory of Money (MV = PQ) as the primary valuation framework. Other approaches were discussed (including network value-to-transaction ratios and Metcalfe's Law variants) but QTM was chosen because it is the broadest model: it directly connects a network's economic throughput to the monetary base needed to support that throughput, and therefore to a per-token fundamental value. The framework was adapted for each asset's specific supply mechanics, including Bitcoin's halving schedule and Ethereum's post-EIP-1559 supply dynamics.
Economic Modeling
FinDaS built the valuation engine in Google Sheets, structured for transparency and auditability, a requirement for institutional-grade work. The model contained four interconnected layers: a TAM market map with 20+ independently sourced sectors, adoption S-curves calibrated per asset, on-chain velocity analysis benchmarked against M2 money supply, and a discounted utility pricing framework projecting 12 years of per-token fair value.
| Deliverable | Description | Why it mattered |
|---|---|---|
| TAM Market Map | 20+ sectors sized with sourced CAGRs (e-commerce, lending, insurance, gaming, IoT, ESG, DAOs, digital identity, and more) | Gave each valuation a bottom-up, auditable economic foundation |
| Adoption S-Curves | Logistic adoption curves calibrated per asset with adjustable inflection points and takeover periods | Allowed institutional readers to stress-test when crypto captures 10%, 50%, or 90% of each market |
| Velocity Analysis | Historical on-chain velocity data for BTC, ETH, BNB, and M2 money supply benchmarks | Anchored the most contentious variable to observed data rather than assumptions |
| Discounted Utility Pricing | 12-year projection of utility price per token, discounted at 30% to reflect crypto risk | Produced a single defensible fair-value number institutional allocators could compare to market price |
Stress Testing and Valuation
FinDaS applied its proprietary valuation framework to stress-test every assumption in the model. Capture rates (the percentage of each market that crypto would take) were set conservatively at 20% for both BTC and ETH across sectors, but the model was built so that Cointelegraph's team and their institutional readers could adjust these inputs and see the impact immediately. Discount rates of 30% reflected the elevated risk premium appropriate for crypto assets in this period.
Documentation and Launch Readiness
Each report was delivered as a 50+ page institutional-grade document. The valuation models were handed over as live, editable spreadsheets so Cointelegraph's research team could run their own scenarios, update market data in subsequent quarters, and present the work to subscribers with full transparency on methodology. The collaboration spanned three reports between 2019 and 2021, with FinDaS refining the model with each edition as new market data, new sectors (DAOs, DePIN precursors), and new on-chain dynamics (Ethereum's transition to PoS) emerged.
Velocity is the variable most crypto valuation attempts ignore or assume away. Empirical calibration from on-chain data is the difference between a credible output and a fantasy number.
What did FinDaS build?
1. Multi-sector TAM architecture
Rather than assigning a single total addressable market to each cryptocurrency, FinDaS decomposed the opportunity into 20+ distinct sectors, from medium of exchange ($82T+) and securitization ($251T+) down to e-sports ($2B) and digital identities ($28B). Each sector was independently sourced from institutional research firms (Grand View Research, Bloomberg, SIFMA, Statista) with its own CAGR and capture rate. This granularity meant the model was not hostage to a single bull-or-bear TAM assumption.
Outcome: Institutional readers could evaluate each sector independently and form their own view on which markets crypto would realistically penetrate.
2. Calibrated adoption S-curves
FinDaS implemented logistic adoption curves with two adjustable parameters: the year fast growth begins (when adoption hits 10%) and the takeover period (time to reach 90% of terminal penetration). For BTC and ETH, fast growth was set to begin in 2023 with a 5-year takeover window. This was not arbitrary: it was calibrated against historical technology adoption patterns and on-chain user growth data.
Outcome: The S-curve converted a static TAM into a dynamic, time-dependent revenue trajectory that institutional models require.
3. On-chain velocity estimation
FinDaS assembled historical velocity data for BTC, ETH, and BNB from on-chain sources and benchmarked them against M2 money velocity in the traditional economy. Bitcoin's velocity of ~6.06 was derived from observed transaction patterns. Ethereum's higher velocity of ~10.5 reflected its role as a smart contract platform with faster turnover. The hold percentage for ETH (~13.7%) was derived directly from staked ETH data, reducing circulating supply in the model.
Outcome: Velocity, the variable most crypto valuation attempts ignore or assume away, became an empirically grounded input rather than a guess.
4. Discounted utility pricing framework
The model computed a per-token utility price each year (network monetary base divided by circulating supply), then discounted it back to present value at a 30% rate reflecting crypto's risk premium. This produced two outputs per asset: a raw utility price trajectory showing long-term fundamental value, and a discounted price series showing what that future value is worth today. Both series are visible in the chart below, illustrating how the discount rate compresses the terminal value into a near-term fair value estimate an institutional allocator can act on.
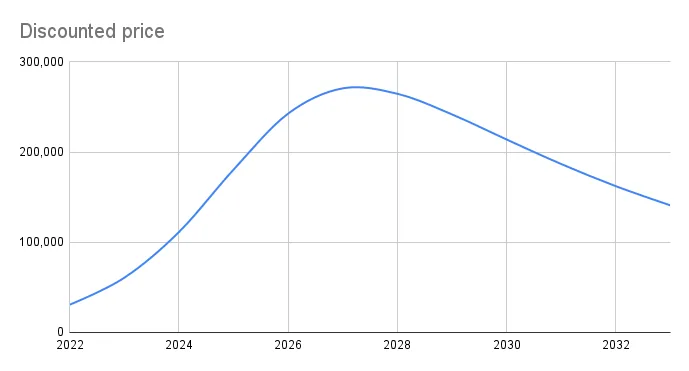
Outcome: Institutional allocators received a framework they recognized (a discounted fundamental value) translated into the language of crypto for the first time in a Cointelegraph publication.
What were the results?
FinDaS delivered three institutional-grade valuation reports to Cointelegraph Research between 2019 and 2021. Each report exceeded 50 pages of analysis, covering multiple top-20 cryptocurrencies with full fundamental valuation models, sourced TAM breakdowns, and scenario-adjustable spreadsheets.
The reports became part of Cointelegraph's exclusive paid research offering, distributed to institutional investors including funds, family offices, and crypto-native allocators. The collaboration spanned three consecutive editions, with each report building on the previous one as new market data emerged and new sectors matured.
For FinDaS, the engagement validated the firm's core thesis: that rigorous, quantitative valuation, the discipline most tokenomics consultancies avoid because it is hard, is the capability institutional buyers value most.
Key takeaways.
Crypto valuation without a first-principles economic framework is just price speculation with extra steps.
Velocity is the most underestimated variable in token valuation
Most models ignore it or treat it as a constant. Empirical calibration from on-chain data is the difference between a credible output and a fantasy number.
TAM analysis requires sector-level granularity
A single "crypto TAM" figure is useless for institutional decision-making. Decomposing it into 20+ independently sourced markets gives the model enough resolution to survive scrutiny.
Institutional-grade means editable
Handing over a PDF is not enough. When the audience manages capital, the deliverable must be a live, transparent model they can stress-test themselves.
Valuation is the tokenomics capability most firms avoid and most buyers need
FinDaS's ability to do this work, and to do it at a level a major crypto publication trusted for its institutional offering, is a direct result of over 200 engagements of pattern recognition.
What's next.
The valuation framework FinDaS developed for Cointelegraph Research has become a foundational component of the firm's tokenomics methodology. Every tokenomics engagement FinDaS undertakes now includes a valuation layer, stress-tested with the same QTM-based approach, sector-level TAM analysis, and velocity calibration first developed for these institutional reports. The Cointelegraph collaboration proved that valuation is not a nice-to-have in tokenomics; it is the anchor that gives every other design decision (allocations, vesting, emissions, monetary policy) an economic reason to exist.
Bring your project to a real token economist.
Free, no obligation, no juniors. We'll answer every question about your token design and tell you candidly where the weak spots are.
The questions we keep getting.
How do you value a cryptocurrency using fundamental analysis?
FinDaS applies the Quantity Theory of Money (MV = PQ): identify the total economic activity a network could capture, estimate the monetary base required, divide by circulating supply for a per-token utility price, and discount to present value. This requires mapping TAMs sector by sector, calibrating velocity from on-chain data, and modeling adoption curves.
What is token velocity and why does it matter for valuation?
Velocity measures how frequently a token changes hands. Higher velocity means less monetary base is needed for the same transaction volume, which suppresses per-token value. FinDaS calibrates velocity from observed on-chain data and benchmarks it against traditional M2 money supply metrics.
What total addressable markets does crypto compete in?
Crypto networks compete across 20+ sectors: medium of exchange, store of value, lending, securitization, insurance, e-commerce, digital advertising, gaming, e-sports, supply chain, cloud storage, IoT, ESG, DAOs, and digital identity. Each has its own market size, growth rate, and realistic crypto capture rate.
Can you produce institutional-grade crypto research as a white-label partner?
Yes. FinDaS has collaborated with Cointelegraph Research on multiple institutional reports, producing 50+ page deliverables with full fundamental models, sourced data, and editable spreadsheets for institutional subscribers managing real capital.
Why do most tokenomics firms avoid token valuation?
It requires TradFi valuation methodology, on-chain data literacy, macroeconomic modeling, and deep understanding of crypto mechanics like staking, burning, and emission schedules. Most firms focus on allocation tables because they are easier. FinDaS treats valuation as the anchor of every design.