
How FinDaS designed trenddi's points economy twice.
trenddi needed a web2-style loyalty program for a live social platform: points, boosts, decay, and a growth loop where more users create more content and more content brings more users. The first design held up on paper. Hundreds of Monte Carlo runs later, large parts of it went back on the table.
TL;DR
- Client: trenddi, a Web3-enabled social network where users earn by creating content, completing tasks, and ranking in leaderboards; live in MVP with tens of thousands of users
- Challenge: design a web2-style points loyalty program (earning, marketplace boosts, decay, gated cash-out) where every parameter is a policy decision with P&L consequences and a reinforcing growth loop amplifies every mistake
- Approach: two phases in two months: full points economy design, then hundreds of Monte Carlo runs in Machinations that stress-tested the design and sent large parts of it back for rework
- Result: an economy proven stable under every tested scenario, a repriced boost and cash-out structure that put the median user back in the loop, and parts of the system shipped to live MVP users
What problems did trenddi have?
A loyalty program with no token has no market to absorb mistakes
trenddi wanted users earning points for likes, comments, shares, content, referrals, and leaderboard positions, without minting those points as a token. The right call for a consumer social product, and the harder one. A token program exports its pricing mistakes to a market; a points program keeps them on the books. Every point issued is a liability the platform eventually honors in boosts, subscriptions, or conversion, and if issuance outruns the budget there is no market cap chart to hide behind. The design had to be generous enough to move behaviour and tight enough that the P&L survives the program's own success.
A reinforcing loop nobody can eyeball
trenddi's growth logic is a loop: more users produce more creators, more creators produce more content, more content brings more users. Every parameter of the points program either feeds that loop or brakes it. A cap set too low stalls creators. A boost priced too high locks out the middle of the distribution. A decay curve set too aggressively punishes exactly the users the platform is trying to reactivate. These effects compound around the loop, which is precisely where intuition stops working. Hristo's position from the first week was that no static spreadsheet would answer whether this specific set of caps, prices, and decay rates produced a healthy economy. It had to be simulated.
Most points had to be spent inside the app
The brief carried one more constraint: the majority of points should be spent inside trenddi, not cashed out. The design answer is gating. Basic engagement earns points for everyone at low rates, while the higher-yield activities (content rewards, leaderboards) sit behind boosts purchased from the marketplace with points. Gate too little and points leak out as conversion pressure. Gate too much and the economy goes inert, with users holding balances too small to spend on anything. Where exactly the gate sits is not answerable from first principles, which became the recurring theme of this engagement.
Nothing in a closed points economy prices itself
The content boost, the cap increases, the multipliers, the cash-out threshold, the decay rate: every one of them is a number somebody has to set, with no market to correct it if it is wrong. Numbers set by feel fail quietly, and the failure surfaces months later as retention data nobody can explain. trenddi needed a pricing logic that could be defended line by line, and a way to test it before real users hit it.
How did FinDaS approach the problem?
Platform and Business Deep Dive
FinDaS started from the live platform, not from a template. trenddi was already running in MVP with tens of thousands of users, which meant real telemetry instead of invented personas: baseline activity of roughly 5 likes, 0.5 shares, and 0.1 comments per user per month, with the top 1% of users generating about 20% of all activity and the top 9% generating 60%. Those measured numbers became the simulation's starting assumptions, and they are a large part of why the later findings were worth acting on.
Points Utility and Value Capture Design
The design phase produced the full points architecture: an earning matrix covering engagement, referrals, content, challenges, and leaderboards, each with daily or monthly caps; one-time performance bonuses for creators crossing follower, like, and view milestones; a marketplace where points buy cap increases, multipliers, and the subscriptions that gate content earning and cash-out; free boosts for new users, new influencers, and reactivated accounts; and points decay to keep balances circulating rather than hoarded. One deliberate bridge connects the program to the $TREND token, described below.
Economic Modeling
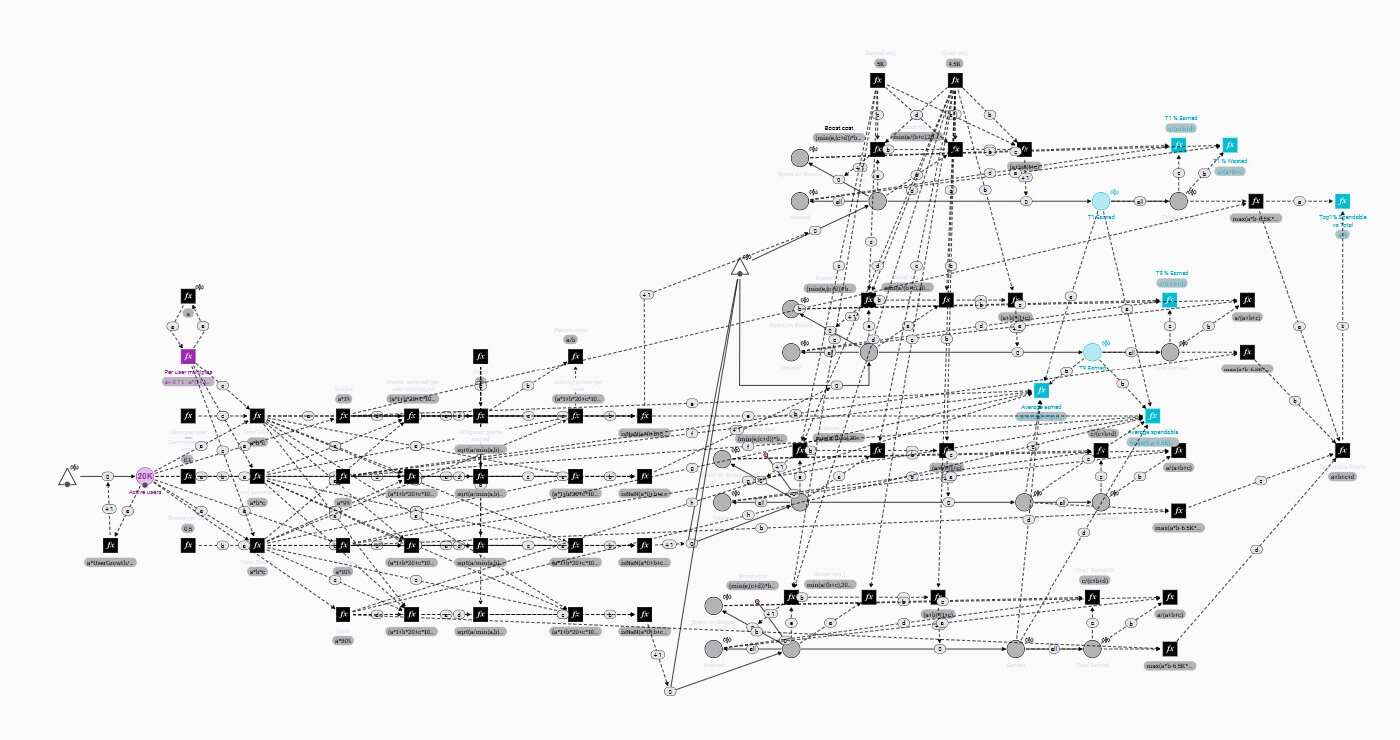
The economy went into Machinations as a full behavioural model: earning rules, caps, boost purchases, decay, and the measured cohort structure. Randomness enters through the two variables the project cannot control, user base growth and per-user activity intensity, each evolved as a bounded random walk so scenarios drift the way real platforms do instead of jumping between extremes. Deterministic budget work stayed in Google Sheets. The simulation then ran hundreds of Monte Carlo iterations, spanning sub-million niche adoption to tens of millions of users, and baseline activity to several hundred times it.
Stress Testing and Findings
The simulation cleared the design on the question that kills web2 programs: no scenario produced runaway issuance, and the caps held for everyone below the top 1% even under extreme growth. Then it flagged the opposite problem. At measured activity levels the median user needed 12 to 18 months to afford a single content boost, cash-out was reachable only by the top 1 to 3% of users within two years, and 70 to 90% of all redeemable value accrued to the top 1 to 9%. A regression across the runs explained roughly 90% of outcome variance, with per-user engagement intensity correlating with average earnings at 0.74 against 0.35 for user count. The system was fiscally sound and economically inert at the same time.
Documentation and Redesign
The findings went back into the design, and large parts of the loyalty program were rebuilt in response; the specific changes are below. The documented output: the trenddi economy paper, the points system specification with worked examples for every formula, and a simulation findings report with recommendations classified as critical, important, and optional, plus the Machinations model itself, handed over so the trenddi team could rerun scenarios as real behavioural data replaced assumptions.
| Deliverable | Description | Why it mattered |
|---|---|---|
| Economy Paper | Full economy documentation: mechanics, sustainability analysis, sensitivity models | Structured by audience: public summary, developer-level detail, internal-only analysis, so each reader gets exactly their layer |
| Points System Specification | Earning matrix, boost marketplace, pricing formulas, decay rules, worked examples | Implementable directly: engineering built from this spec, and parts of it shipped to live MVP users |
| Simulation Findings Report | Hundreds of Monte Carlo runs, correlations, regression, scenario groups, prioritized recommendations | Turned parameter debates into evidence: every redesign traces to a specific finding, not an opinion |
| Machinations Model | The live simulation diagram and run configuration | trenddi can rerun scenarios itself as real user data replaces the starting assumptions |
No scenario produced runaway inflation, and the median user needed over a year to afford a single boost. The points economy was unbreakable and unusable at the same time.
What did FinDaS design?
1. An earning matrix gated behind the marketplace
Engagement earning is open to everyone and deliberately small: 1 point per like, 10 per share, 20 per substantive comment, capped at 50 points per day per action type. The real earning, content rewards and leaderboards, requires an active boost from the marketplace, and every new account gets one free so the habit forms before the paywall matters. Referral earning scales with the referred user's activity, capped monthly. Creators crossing follower and view milestones collect one-time performance bonuses, restricted to verified accounts so the tiers cannot be farmed with duplicate profiles.
Outcome: The majority of points get spent inside the app by construction, not by hope, because the highest-yield earning is itself the thing points buy.
2. Gap-to-cap boost pricing
Every boost has a price derived from its yield rather than picked in a meeting: a boost costs 25% less than the maximum benefit it can deliver. A cap-increase boost that can add at most 100 points costs 75. A 50% multiplier boost against the 5,000-point content cap tops out at 1,666 extra points, so it is priced near 1,600. At baseline activity these purchases are barely worth it, and they get progressively more efficient as a user's caps and activity rise, which points spending toward exactly the committed users the loop needs.
Outcome: Every price in the marketplace is defensible line by line, and boost economics automatically favor the users whose activity feeds the flywheel.
3. Decay instead of expiry
Points hold full value for 3 months, then decay linearly over 100 days, with alerts before anything is lost. Spending is FIFO, oldest points first, so active users rarely lose value to decay at all. Inactivity is handled separately: an account that stops logging in loses 20% of its balance after a month and the rest after three, while an account that logs in but stops participating gets a free re-engagement boost instead of a penalty.
Outcome: Hoarding is penalized and activity is rewarded, without the cliff-edge expiry dates that generate support tickets and resentment.
4. The redesign the simulation forced
This is the part of the engagement that changed the design most. The original accrual curve grew as the square root of engagement, a conservative choice that turned out to suppress exactly the middle of the distribution: doubling your activity earned you roughly 40% more points. FinDaS replaced it with a linear model. The 2,000-point content boost, which the median user needed 12 to 18 months to afford, was recommended down to 500 to 800 points, or free during early adoption. The 6,500-point cash-out threshold got two options: cut it to roughly 2,000, expanding eligible users 4 to 6 times, or keep it and run instrumented discount windows. And Happy Hours, time-limited 50 to 90% discounts on boosts, were built in as standing experiments: each discount event doubles as an elasticity measurement that feeds the next round of pricing.
Outcome: The median user came back inside the economic loop, and every relaxation of the rules arrived with a measurement plan attached rather than as a leap of faith.
5. A one-way bridge to the token
trenddi is a Web3-enabled platform, so the program includes a single controlled exit: users holding a conversion subscription can swap points for $TREND tokens through an internal one-way pool. Points flow in, tokens flow out, never the reverse, and the platform controls the exchange rate by managing the pool's balances. The loyalty program stays a closed web2 system on the P&L while still offering users an exit with real value.
Outcome: Web2 loyalty economics with a web3 exit, on terms the platform sets rather than terms a market sets for it.
What were the results?
Parts of the points system shipped to trenddi's live MVP, a platform with tens of thousands of users, which is a test most loyalty designs never face. The simulation work delivered its own result before any launch: a validated statement that the economy holds under every tested scenario, from minimal activity to extreme growth, plus a repriced boost and cash-out structure with the evidence for each change documented in the findings report.
trenddi's parent group has since directed its strategy away from social media, so the full economy never met the scale it was built for, and this case study claims no long-run numbers: no retention curves, no redemption rates at scale. What the engagement demonstrates is the discipline that comes before those numbers, and the finding that has transferred to every loyalty program FinDaS has designed since: a points economy with a reinforcing growth loop cannot be validated on paper, only in simulation.
Key takeaways.
A points program is a monetary system running on your P&L. Every point issued is a liability, no market absorbs a mispriced reward, and the only way to test the system before your users do is to simulate the behaviour that will hit it.
Reinforcing loops defeat intuition
Any economy whose output feeds its input compounds small parameter errors into structural outcomes. trenddi's square-root accrual curve looked prudent in isolation; around the loop, it flattened the motivation gradient for the entire middle of the user base.
Launch conservative, then loosen with data
Cutting a boost price by 70% in a discount event is a marketing beat. Raising one is a community incident. That asymmetry means the correct launch posture is deliberately tight parameters plus instrumented discounts that generate the data for permanent repricing.
Engagement depth beats headcount
Across hundreds of runs, per-user activity intensity correlated with average earnings at 0.74; user count managed 0.35. If the economics need improving, the lever is engagement per user, not acquisition.
Design for the median user
The top 1% thrives under almost any ruleset. A loyalty economy fails when the median user is priced out of its own reward loop, and median lockout is invisible in aggregate issuance numbers. It only shows up when you simulate the full distribution.
What's next.
The design-then-simulate sequence built for trenddi now opens every FinDaS loyalty engagement, with or without a token: wallets, fintech apps, and consumer platforms that want loyalty economics with no token in sight. The mechanics differ per client; the discipline does not. If you are weighing a program of your own, points systems covers the design space and web2 tokenomics covers where these programs sit relative to token models.
Bring your loyalty program to a real token economist.
Free, no obligation, no juniors. We'll answer every question about your points or token design and tell you candidly where the weak spots are.
The questions we keep getting.
How do you design a points-based loyalty program without a token?
Treat it as a monetary system: issuance is the earning matrix, sinks are the marketplace and decay, and the exit is gated cash-out. Every point issued is a liability on the P&L, so budgets, caps, and prices are set at design time rather than discovered by a market. For trenddi, FinDaS designed the full architecture first and then validated it with Monte Carlo simulation before launch.
Why do loyalty programs need economic simulation?
Because engagement loops compound: more users create more content, which attracts more users, and every cap, price, and decay rate feeds back into that loop. trenddi's design looked sound on paper, yet hundreds of Monte Carlo runs showed the median user needed 12 to 18 months to afford a single boost. Simulation catches the failure modes that static spreadsheets structurally cannot.
What is the biggest risk in a web2 points program?
There are two, and they pull in opposite directions. Over-issuance exhausts the rewards budget and lands directly on the P&L, while over-conservatism makes rewards so small that users stop caring. trenddi's first design sat safely on the conservative side, which the simulation exposed as its own failure mode.
How should you price boosts and rewards in a closed points economy?
Derive prices from yield instead of picking numbers in a meeting. FinDaS priced trenddi's boosts at 25% below their maximum achievable yield, then layered time-limited discount events of 50 to 90% on top as controlled experiments. The discounts double as research: user response to each discount tier tells you what the permanent price should be.
Should loyalty points expire or decay?
Decay, in most cases: a hard expiry date creates cliff anxiety and support tickets. trenddi's points hold full value for 3 months and then decay linearly over 100 days, with the oldest points always spent first so active users rarely lose anything. Separate inactivity penalties handle abandoned accounts without touching engaged ones.
Can a web2 loyalty program connect to a crypto token later?
Yes, and the connection can be one-directional by design. trenddi's program bridges points to the $TREND token through an internal one-way swap pool, so points can become tokens but tokens never flow back into the points economy, and the platform controls the conversion rate. The loyalty program stays a closed web2 system with a single controlled exit.